Testing
Testing
We tested the LANShark with the latest drivers at time of writing. Software used is listed below:
-
Forceware 185.85
- 3DMark Vantage
- Everest5 Ultimate (v5.01)
- Sandra 2009.SP3c
- Far Cry 2
- Cinebench R10
- RivaTuner v2.24
- FRAPS
- CPUID 1.51
- Paint.NET
- GIMP 2.6
Queen CPU test
This simple integer benchmark focuses on the branch prediction capabilities and the misprediction penalties of the CPU. It finds the solutions for the classic "Queens problem" on a 10 by 10 sized chessboard. At the same clock speed theoretically the processor with the shorter pipeline and smaller misprediction penalties will attain higher benchmark scores. For example -- with HyperThreading disabled -- the Intel Northwood core processors get higher scores than the Intel Prescott core based ones due to the 20-step vs 31-step long pipeline. However, with enabled HyperThreading the picture is controversial, because due to architectural bottlenecks the Northwood core runs out of internal resources and slows down. Similarly, at the same clock speed AMD K8 class processors will be faster than AMD K7 ones due to the improved branch prediction capabilities of the K8 architecture.
CPU Queen test uses only the basic x86 instructions, it consumes less than 1 MB system memory and it is HyperThreading, multi-processor (SMP) and multi-core aware and thus is a multithreading CPU Benchmark with MMX, SSE2 and SSE3 optimizations.
ZLib CPU test
This integer benchmark measures combined CPU and memory subsystem performance through the public ZLib compression library Version 1.2.2
CPU ZLib test uses the basic x86 instructions, it is HyperThreading, and multi-core (CMP) aware. A very good test to measure multi-core performance among platforms.
AES data encryption
For this test we encrypt some precious data. Data encryption has become a sad necessity for responsible data managers. Cryptography is the science of secret codes, enabling the confidentiality of communication through an insecure channel. The AES algorithm uses one of three cipher key strengths: a 128-, 192-, or 256-bit encryption key (password). Each encryption key size causes the algorithm to behave slightly differently, so the increasing key sizes not only offer a larger number of bits with which you can scramble the data, but also increase the complexity of the cipher algorithm. AES encryption is applied in a lot of compressing software like WinZIP.
Memory Read test
Obviously we also had to peek at memory bandwidth performance. Now, obviously Intel has an advantage here, triple-channel memory. This explains the tremendous amount of read performance for the Core i7 platform. Total Boner ! (sorry).
Memory Write test
The same can be said for the memory write tests. Of course Intel dominates here and considering we used 1333 JEDEC timed memory on both platforms. Triple channel performance on Nehalem is just frighteningly good really.
3DMark Vantage (DirectX 10)
3DMark Vantage focuses on the two areas most critical to gaming performance: the CPU and the GPU. With the emergence of multi-package and multi-core configurations on both the CPU and GPU side, the performance scale of these areas has widened, and the visual and game-play effects made possible by these configurations are accordingly wide-ranging. This makes covering the entire spectrum of 3D gaming a difficult task. 3DMark Vantage solves this problem in three ways:
1. Isolate GPU and CPU performance benchmarking into separate tests,
2. Cover several visual and game-play effects and techniques in four different tests, and
3. Introduce visual quality presets to scale the graphics test load up through the highest-end hardware.
To this end, 3DMark Vantage has two GPU tests, each with a different emphasis on various visual techniques, and two CPU tests, which cover the two most common CPU-side tasks: Physics Simulation and AI. It also has four visual quality presets (Entry, Performance, High, and Extreme) available in the Advanced and Professional versions, which increase the graphics load successively for even more visual quality. Each preset will produce a separate, official 3DMark Score, tagged with the preset in question.
The graphics load increases significantly from the lowest to the highest preset. The Performance preset is targeted for mid-range hardware with 256 MB of graphics memory. The Entry preset is targeted for integrated and low-end hardware with 128 MB of graphics memory. The higher presets require 512MB of graphics memory, and are targeted for high-end and multi-GPU systems.
Some hate it, some love it, here are the 3DMark Vantage score results. We start off with the standard test run, above you can observe the P (performance) score. The results are all done with the included BFG GeForce GTX 295 graphics card on an Asus Rampage 2 Extreme (X58) 6GB Triple channel memory and the Core i7 965 clocked at 3.75 GHz, and it's clear that the P score is very CPU bound, you can verify that by overclocking (all the way on top).
Far Cry 2
Image Quality setting:
- 8x Anti Aliasing
- 16x anisotropic filtering
For the sake of it, here's a test run with Far Cry 2 both standard (3600 Mhz) and additionally overclocked (3900 MHz) as well, yeah that doesn't suck.
CineBench R10 3D Rendering
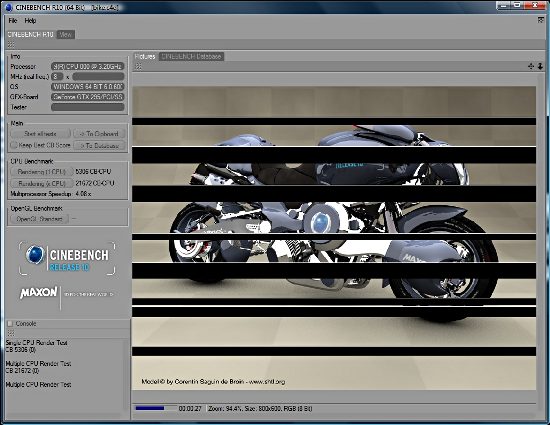
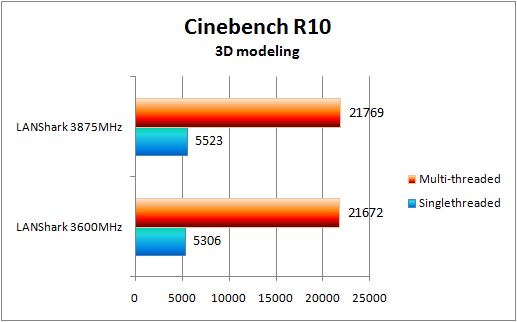
Cinebench R10 is an interesting little benchmark that makes very good use of multi-CPU and multi-threading processing. So after re-enabling hyperthreading, we let Cinebench loose on the i7. Here are the LANShark 3600MHz results:

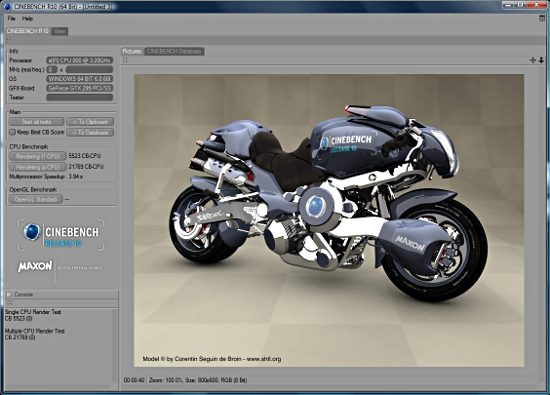
For the 3875 MHz results, we have an alsmot 300 MHz speed boost, but again, the CPU might be throttling and lowering the actual results.


Not much of a gain here for overclocking performance wise. Even in the 'stock' 3600MHz form, the LANShark is hard charging like a bull in Pamplona. If you're into 3D modeling, you really can't go wrong with an Intel i7.
HDD Everest Disk Benchmark
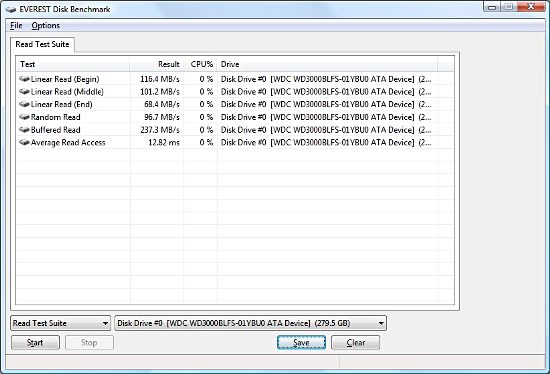
Everest includes a handy benchmark for hard drives. As we know, the LANShark comes with a Wester Digital 300GB VelociRaptor, quite possibly the fastest mechanical hard drive on the market.

Random read is about 68.4 MB/s, which is just a little bit low, despite running in the preferred AHCI mode.
