Page 10 - AquaMark 3
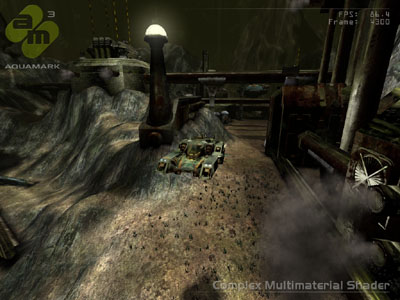
AquaMark 3The latest graphics cards on the market are almost all DirectX9 compatible these days, and we also see an increasing number of games utilizing the new DX9 features. To be able to see how well a graphics cards is performing in this new challenging DirectX 9 environment, AquaMark was developed.
The AquaMark3 benchmark delivers scores for specific hardware components as well as an overall score for the entire system. AquaMark3 is highly qualified to meet the needs of gamers because it's as close as possible to a typical game application. The AquaMark benchmarking series is based directly on the huge code and data base of the AquaNox games and the underlying krass game engine."
In the past we have used AquaMark 2.3 in our benchmark suite and although still a reputable application, Massive figured it was time for the next best thing. This is AquaMark 3, a benchmark that will utilize some of the finest DirectX 9 capabilities like Pixel and Vertex Shaders 2.0, and yet is by far not as Shader dependant as Half-Life is, for example. You will notice that in the overall results later in this article.
AquaMark 3, however, is not solely a DirectX9 benchmark; if you are working with a DirectX 8 or 7 compatible graphics card, you will still be able to use it just with a lot of graphical features missing. Make no mistake, AquaMark3 is a DirectX 9 benchmark. But since it's based on a real game engine it has fallbacks to DirectX 8 and even DirectX 7 making this software not a 100% DX9 benchmark.
Download: Aquamark 3 (63 MB)
| AquaMark 3 | 800x600 | 1024x768 | 1280x1024 | 1600x1200 |
| FX 5600 | 24 | 21 | 17 | 13 |
| 9600 256 | 29 | 23 | 17 | 13 |
| Creative R9600 | 29 | 23 | 17 | 13 |
| 9600 Pro | 31 | 25 | 19 | 14 |
| FX 5700 | 36 | 30 | 23 | 18 |
| R9600XT | 41 | 35 | 26 | 20 |
| FX 5700 Ultra | 41 | 35 | 27 | 21 |
| 9700 Pro | 46 | 41 | 33 | 26 |
| 9800 Pro | 49 | 45 | 38 | 30 |
| FX 5900 XT | 48 | 43 | 36 | 29 |
| 9800 Pro | 50 | 44 | 38 | 30 |
| 9800XT | 51 | 46 | 40 | 33 |
| FX 5900 Ultra | 52 | 48 | 41 | 34 |
| FX 5950 Ultra | 53 | 49 | 43 | 36 |
| 550/700 | 43 | 37 | 26 | 20 |
I know that the names look a bit funny. Without Anisotropic filtering and AA enabled here, the results are in favor for NVIDIA in the high-end range. This will change when we enable some IQ settings though. As you can see the Radeon 9600 XT is performing as well as the GeForce FX 5700 Ultra.
| 4xAA 8xAF | 800x600 | 1024x768 | 1280x1024 | 1600x1200 |
| FX 5600 | 16 | 13 | 9 | 7 |
| 9600 256 | 21 | 16 | 12 | 8 |
| FX 5700 | 22 | 17 | 12 | 9 |
| 9600 Pro | 24 | 18 | 13 | 9 |
| FX 5700 Ultra | 26 | 19 | 14 | 11 |
| R9600XT | 32 | 25 | 19 | 12 |
| FX 5900 XT | 34 | 26 | 19 | 15 |
| FX 5900 Ultra | 39 | 31 | 23 | 17 |
| 9700 Pro | 39 | 32 | 24 | 19 |
| FX 5950 Ultra | 40 | 32 | 24 | 18 |
| 9800 Pro | 43 | 36 | 27 | 21 |
| 9800XT | 45 | 39 | 30 | 23 |
It's obvious that the mighty Radeon series have the overall performance edge here, especially the mid-range dominates. The results as demonstrated here on all cards have Anti Aliasing at 4 levels and Anisotropic Filtering at 8x enabled.

