Current Benchmark Methods
Time Based Latency Measurements
So then, over the past year or so there has been a new measurement introduced, latency measurement. Basically it is the opposite of FPS.
- FPS mostly measures performance, the number of frames rendered per passing second.
- Frametime mostly measures and exposes anomalies - here we look at how long it takes to render one frame. Measure that chronologically and you can see anomalies like peaks and dips in a plotted chart, indicating something could be off. It is a far more precise indicator.
So, when you take a number of seconds of a recording whilst tracking the number of frames per second, then output that in a graph and then zoom in, you can see the turnaround time it takes to render one frame. Basically, the time it takes to render one frame can be monitored, tagged and bagged. It's commonly described as latency. One frame can take say 17 ms. A while ago there were some latency discrepancies in-between NVIDIA and AMD graphics cards with results being worse for AMD, for multi-GPU solutions. We followed this development closely and started implementing FCAT.
What Triggered All This Frametime and pacing stuff?
First off, microstuttering and related anomalies apply only to multi-GPU setups. Single GPU based cards did not show what you are about to see. Let me show you (everything below is based on the OLD drivers and these DO NOT have frame pacing corrected):
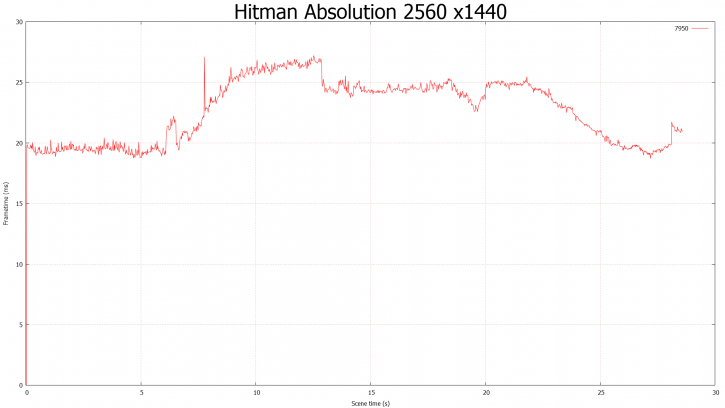
Above, Hitman Absolution, 30 seconds measured with FCAT with what I think was Catalyst 13.4 at the time. Notice how incredibly clean that output looks? You are looking at latency per frame, lower is better and anything above roughly 40ms would be considered slowish or stuttering. This is the perfect picture you want to see really.
So, below is the reason why FCAT frametime measurements took over technology editors like a storm, it could actually show significant anomalies. See, FRAPS had shown weird anomalies with AMD Crossfire configurations that are not in line with what you'd expect to see. But this is what happened when we fired up FCAT again on a dual-GPU solution.
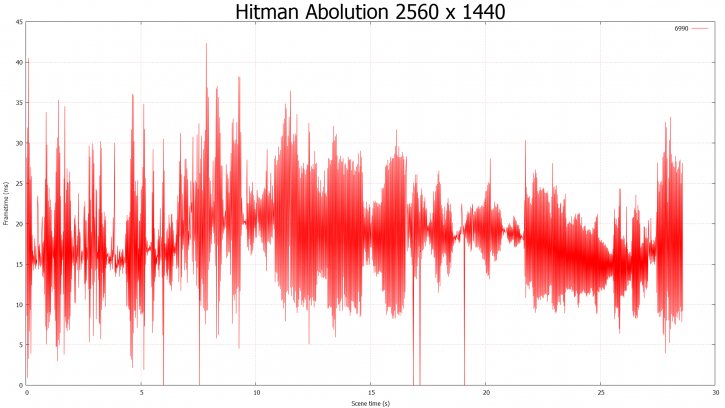
Above, you see an older Radeon HD 6990 (multi-GPU) (at the time), 2560x1440 and basically what happens is that with each frame that is rendered, in the next frame the latency drops and then the next goes up again. So basically high-low-high-low-high-low-high-low.
A few lines of the RAW data (latency per frame):
Data point 0 - 13.063
Data point 1 - 20.372
Data point 2 - 9.369
Data point 3 - 20.372
Data point 4 - 9.809
Data point 5 - 21.273
Data point 6 - 8.750
Data point 7 - 24.234
Data point 8 - 8.896
Data point 9 - 24.640
The data-point is frame-number and the result is displayed in milliseconds.
The odd / even results can be described as micro-stutter, it takes one frame to be rendered a lot faster then the other. But with the data-set at hand, we can now zoom in as well. What you see above is the stuff that FCAT can visualize and detect. Anything that is not smooth in the graph can be considered some sort of event, happening, anomaly or error.
Both Nvidia and AMD have been hard at work and these days the framepacing results are so much better. FCAT however has grown to become a precise instrument that can be used in single and multi-GPU setups to complement your regular FPS measurements, by visualizing what is happening on-screen compared to the competition.


