Page 6
A real-world testing experience slash scenario
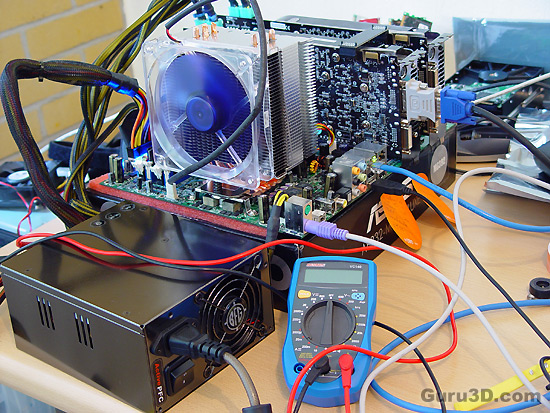
We have to settle for real-world experiences. We took the similar setup we used in our previews PSU test. Our NFORCE 590 SLI reference mainboard. We equipped it with Conroe dual-core E6600 processor and overclocked it towards 3.4 GHz to make sure we are using a lot of power.
Now we equip this system with 2x GeForce 8800 GTX 768 MB, set up in SLI, 2 GB DDR2 memory @ 800 MHz, and an HDD. We now overclock the graphics cards at 625 MHz on the core and 2100 MHz for it's memory. Remember that we already overclocked the processor from 2400 MHz towards 3.4 GHz as well !
We loaded up SLI drivers, and enabled a seriously funky gaming experience at a monitor resolution of 1920x1200 (a good balance between hefty GPU usage whilst using the CPU at maximum as well). Pretty spiffy stuff huh ?
Now for the test we looped test 2 (nature) of 3Dmark06 which is a total bitch on graphics cards, it makes them sweat ! We set the resolution at 1920x1200 enabled 8xAA and 16xAF to make sure the graphics cards are being kicked in the proverbial nuts.

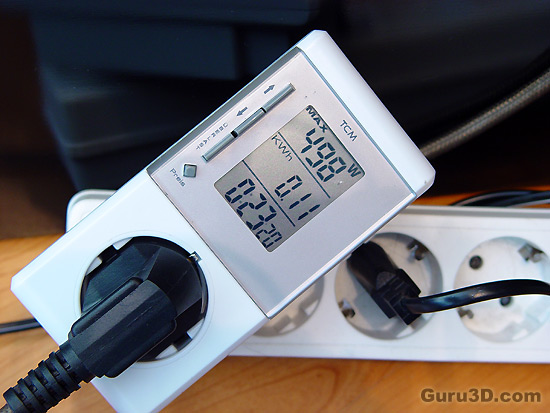
We run this test three times and monitor the behavior of the PSU with a wattage meter and multi-meter. The wattage meter will tell us how much peak wattage we were able to pull from this PC. The more efficient a PSU is the more subjective this test is though.
The power-meter will tell us how much voltage is boosted though the voltage rails, as we can measure fluctuations in power distribution. Let's have a look at that.
Lowest V is the lowest measured value and Highest V of course the highest voltage peak we measured. Actually a 5% fluctuation is perfectly acceptable according to ATX specifications, so 12 Volts should remain between 11.4 - 12.6v as you can see the PSU when stressed stays FAR from that.
Both the green and blue line are almost 100% the same, that means there was no real fluctuation in power distribution. In other words, very stable !
So we took both the primary voltages in both IDLE and LOAD (fully utilized) modes. We noted down the lowest and highest value we see and that is the fluctuation. If a PSU is unstable we'd see much fluctuation, differences and discrepancies which can result in system instability.
Really impressive as despite the fact this is a Kilowatt PSU the wattage did peak towards roughly 500 Watts a couple of times.

As you can understand it's really hard to stress PSU's like these. The fact that it remains stone cold at a 500 Watt power draw tells me that it can easily cope with the load. I just can't test if it actually can manage 1000 Watts as quite frankly I'd need the new ATI R600 in Crossfire and even then I would run a little short.
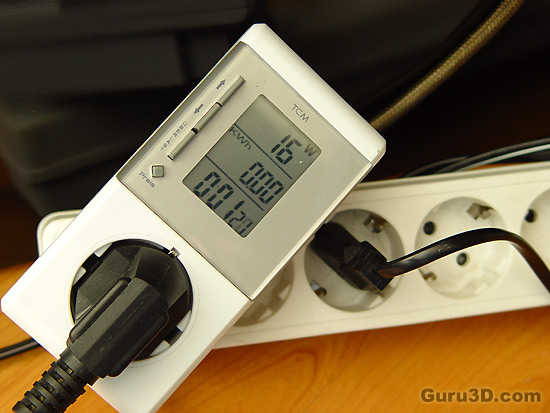
How much power is consumed while the PC is off ...

Here you go, your PC will still draw 16 Watts at all times. This is pretty common.
Now then, you've had a peek at the photo's, combined all factors, and now you should have a pretty broad idea of how this PSU would function for your current or future PC. Quite honestly, I did my best. In a 3D intensive test run with 100% utilization, in an overclocked environment this youngster is stable as can be. Remember this was tested on a NVIDIA GeForce 8800 GTX (overclocked) SLI system with an overclocked (+ 1000 MHz extra) E6600 Core 2 Duo processor.
Sound levels (dBA)
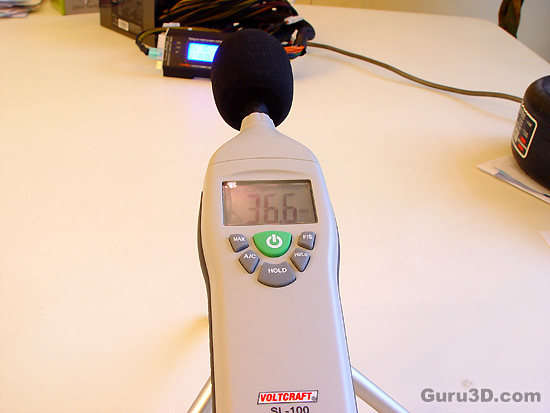
As usual we grabbed our dBa meter, enabled the PSU by hot-wiring it and started to listen if it made any significant noise. Short and simple it's silent, yet the fan in the PSU make some noise. Not at all irritating as it's a nice level below 40 dBA.
The human hearing system has different sensitivities at different frequencies. This means that the perception of noise is not at all equal at every frequency. Noise with significant measured levels (in dB) at high or low frequencies will not be as annoying as it would be when its energy is concentrated in the middle frequencies. In other words, the measured noise levels in dB will not reflect the actual human perception of the loudness of the noise. That's why we measure the dBa level. A specific circuit is added to the sound level meter to correct its reading in regard to this concept. This reading is the noise level in dBA. The letter A is added to indicate the correction that was made in the measurement.

All in all very acceptable sound level and thus recommended to any of the audiophiles that like silence (yours truly included). As always we measure 75 CM away from the product (usually the distance between you and a desktop computer), and yes, this test is always a tad subjective.
